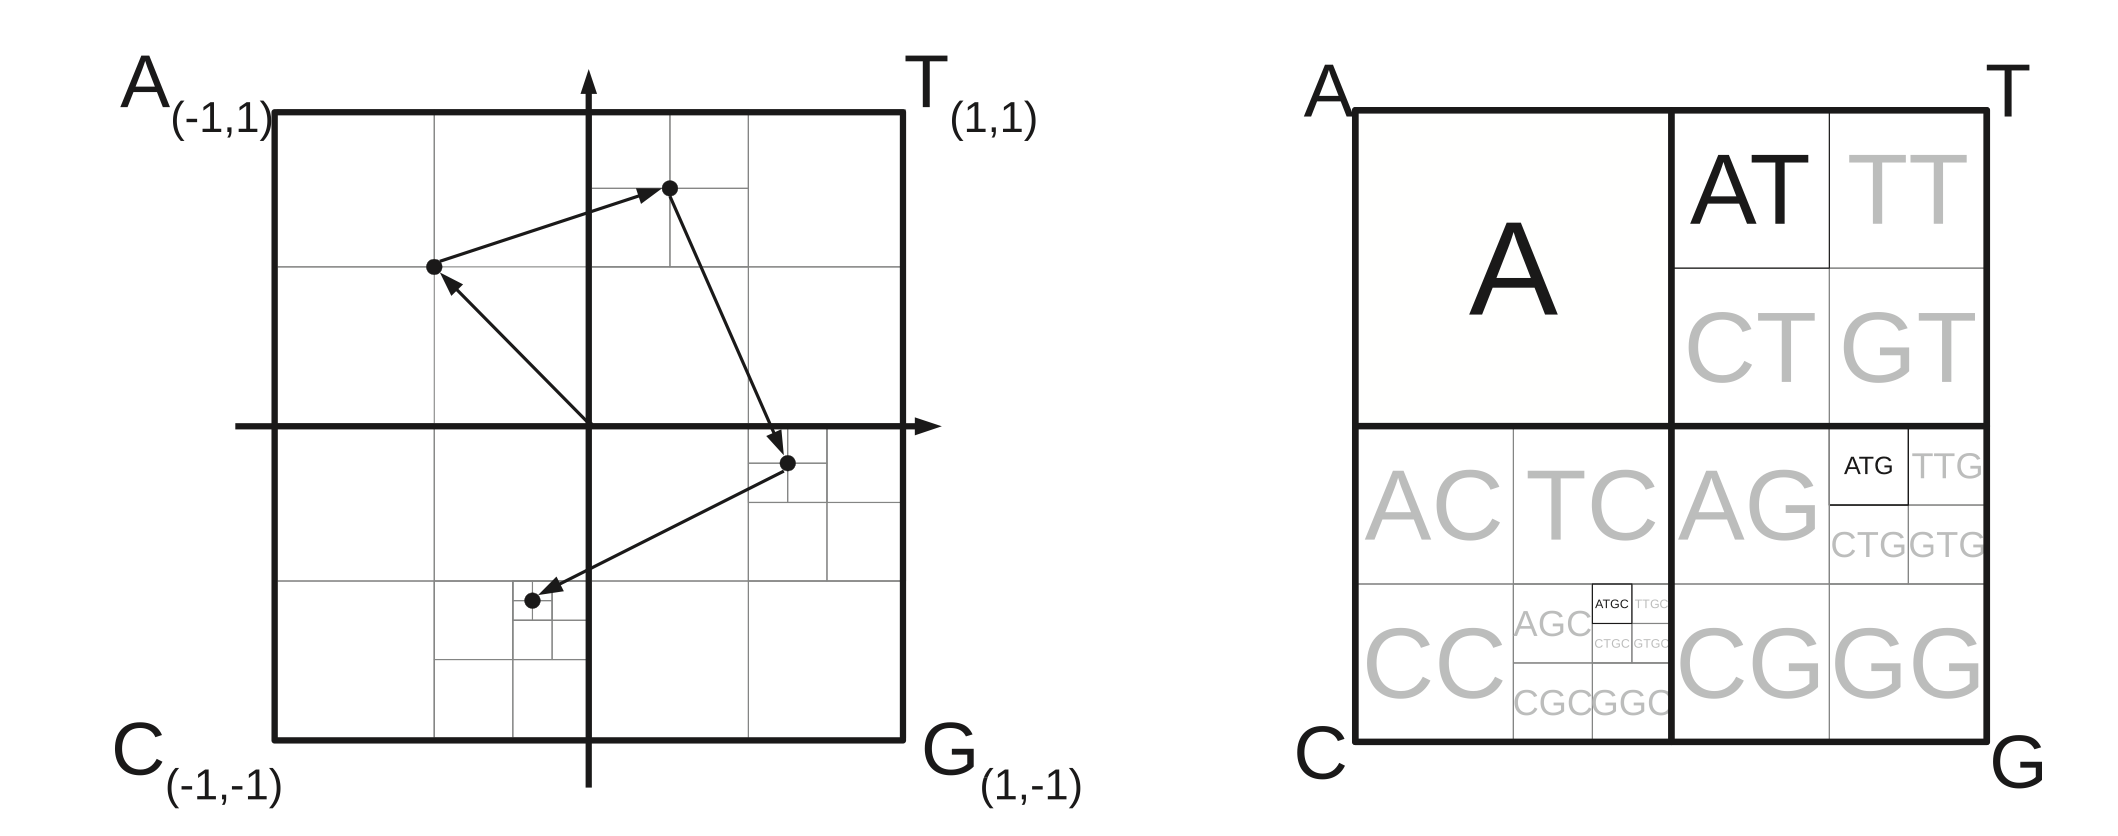
Holistic visualization of a discrete sequence as a fractal pattern.
I found this technique when I was exploring different ways to visualize data. I thought there might be some applications to the population codes created by an assemblage of neurons.
Description
Video showing construction of chaos game visuals https://www.youtube.com/watch?v=Y_o9Vo5nTT0&t=534s
Can be used to visualize gene sequences consisting of elements .
Python construction and examples https://towardsdatascience.com/chaos-game-representation-of-a-genetic-sequence-4681f1a67e14
Frequency matrix CGR (FCGR) seems to be a shortcut for gene CG visualizations. It exploits the 4-element sequence structure and pre-computes k-mer probabilities to build a 2D table/visual. It is also uniquely interpretable based on the quad-tree like segmentation of the space based on the k-mer elements.
[source of image]

Abstract
Chaos game representation (CGR), a milestone in graphical bioinformatics, has become a powerful tool regarding alignment-free sequence comparison and feature encoding for machine learning. The algorithm maps a sequence to 2-dimensional space, while an extension of the CGR, the so-called frequency matrix representation (FCGR), transforms sequences of different lengths into equal-sized images or matrices. The CGR is a generalized Markov chain and includes various properties, which allow a unique representation of a sequence. Therefore, it has a broad spectrum of applications in bioinformatics, such as sequence comparison and phylogenetic analysis and as an encoding of sequences for machine learning. This review introduces the construction of CGRs and FCGRs, their applications on DNA and proteins, and gives an overview of recent applications and progress in bioinformatics.
H. Löchel, D. Heider, Chaos game representation and its applications in bioinformatics, https://doi.org/10.1016/j.csbj.2021.11.008